Employee absenteeism is costing businesses more than most leaders realize. Studies show that organizations lose over 2.8 percent of total working hours every year due to employee absence, and in large companies this can translate into thousands of lost work hours and millions in productivity loss annually. When teams frequently miss work without proper tracking or analysis, it becomes difficult for managers to maintain schedules, control labor costs, and keep projects running smoothly. This is why understanding the absenteeism rate formula is critical for modern HR and operations teams.
The absenteeism rate formula helps organizations measure how often employees are absent from work during a specific period. In simple terms, it calculates the percentage of absence compared to total available workdays. By measuring this metric consistently, companies can identify attendance trends, detect potential productivity issues, and understand how absence patterns impact workforce performance.
Many organizations already rely on workforce analytics metrics to monitor employee productivity, labor efficiency, and operational performance. Absenteeism is one of the most important metrics within this framework because even a small increase in absence can significantly affect productivity and scheduling. For example, if a team of 50 employees misses just 3 days per month, the organization loses 1,800 work hours in a year, which directly affects output, deadlines, and operational planning.
Another closely related metric is the employee utilization rate, which measures how effectively employees use their working hours on productive tasks. While utilization focuses on how employees spend their time at work, absenteeism focuses on how often employees are not present. When these two metrics are analyzed together, organizations gain a clearer view of workforce efficiency, resource allocation, and productivity performance.
In this guide, you will learn the complete absenteeism rate formula, understand how to calculate absenteeism step by step, explore real examples, and discover common benchmarks used by HR teams. You will also learn how organizations use attendance data and workforce analytics to improve productivity, reduce unexpected absences, and build a more efficient workforce.
What Is Absenteeism Rate
The absenteeism rate measures how often employees miss scheduled workdays during a specific period. It is calculated as a percentage that compares total absence days with total available workdays. This metric helps organizations understand employee attendance patterns and identify potential productivity risks.
In most workplaces, a small level of absence is normal due to illness, personal leave, or emergencies. However, when absenteeism rises beyond normal levels, it can disrupt operations and reduce productivity. For example, if a company with 100 employees loses just 2 percent of workdays to absence, it can result in hundreds of lost work hours each year.
Organizations often track absenteeism as part of broader workforce analytics metrics used to monitor employee performance and operational efficiency. When absenteeism increases, it usually signals scheduling challenges, workload imbalances, or employee engagement issues.
Absenteeism is closely related to the employee utilization rate, which measures how effectively employees spend their working hours on productive tasks. When both metrics are analyzed together, businesses gain a clearer picture of workforce efficiency and productivity.
Absenteeism Rate Formula
The absenteeism rate formula helps organizations measure the percentage of work time lost due to employee absence. This formula compares the total number of absence days with the total number of available workdays in a given period. HR teams use this calculation to understand attendance trends and evaluate how employee absence affects productivity and workforce planning.
Standard Absenteeism Rate Formula
Absenteeism Rate = (Total Number of Absence Days ÷ Total Available Workdays) × 100
This formula converts absence data into a percentage, making it easier to compare attendance patterns across teams, departments, or time periods.
Key Components of the Absenteeism Formula
Understanding the variables used in the formula is important for accurate calculation.
Total Absence Days
This refers to the number of workdays employees are absent during a specific period. Absence may include sick leave, unplanned leave, or other unapproved absences depending on company policy.
Total Available Workdays
This represents the total number of workdays employees are expected to work during the same period. It is usually calculated by multiplying the number of employees by the total working days.
Organizations often collect this data through attendance systems, timesheets, or employee tracking tools. Accurate attendance data helps HR teams monitor absence patterns and connect them with other workforce analytics metrics used to evaluate workforce performance.
When absenteeism is analyzed alongside productivity indicators such as the employee utilization rate, companies gain deeper insights into how employee attendance influences overall workforce efficiency.
How to Calculate Absenteeism Rate Step by Step
Calculating the absenteeism rate is straightforward when attendance data is organized properly. HR teams typically gather this information from timesheets, attendance records, or employee tracking systems. Once the data is available, the absenteeism rate can be calculated using a few simple steps.
Step 1 Identify the Total Number of Employees
First determine how many employees are included in the calculation. This could be a specific team, department, or the entire organization depending on the analysis you want to perform.
Step 2 Calculate Total Available Workdays
Next calculate the total number of workdays available during the selected period. This is done by multiplying the number of employees by the total working days in that timeframe.
For example, if a company has 50 employees working 20 days in a month, the total available workdays would be:
50 × 20 = 1000 available workdays
Step 3 Identify Total Absence Days
Now determine the total number of days employees were absent during the same period. This includes sick leave, unplanned leave, or other absence types depending on company policy. Accurate attendance records are important to ensure the calculation reflects the real absence level in the organization.
Step 4 Apply the Absenteeism Rate Formula
Once you have both values, apply the absenteeism rate formula.
Absenteeism Rate = (Total Absence Days ÷ Total Available Workdays) × 100
For example, if employees were absent for 40 days out of 1000 available workdays, the calculation would be:
(40 ÷ 1000) × 100 = 4 percent absenteeism rate
This percentage shows how much work time was lost due to employee absence and helps organizations understand attendance trends over time.
Absenteeism Rate Calculation Examples
Understanding the absenteeism rate formula becomes easier when you see how it works in real workplace situations. The following examples show how organizations calculate absenteeism using actual attendance data.
Example 1 Small Business Example
A small company has 20 employees, and each employee works 22 days in a month.
Total available workdays:
20 × 22 = 440 workdays
During that month, employees were absent for a total of 11 days.
Applying the formula:
(11 ÷ 440) × 100 = 2.5 percent absenteeism rate
This means 2.5 percent of total workdays were lost due to employee absence during that month.
Example 2 Corporate Team Example
A department has 75 employees, and each employee works 20 days in a month.
Total available workdays:
75 × 20 = 1500 workdays
During the same period, employees recorded 45 absence days.
Absenteeism rate calculation:
(45 ÷ 1500) × 100 = 3 percent absenteeism rate
This shows that 3 percent of scheduled workdays were missed due to absence.
Example 3 Department Level Calculation
A project team has 30 employees, each working 21 days in a month.
Total available workdays:
30 × 21 = 630 workdays
If the team records 12 absence days, the absenteeism rate becomes:
(12 ÷ 630) × 100 = 1.9 percent absenteeism rate
Examples like these help HR teams understand how absence patterns affect workforce performance. When organizations track absenteeism regularly, they can detect attendance trends early and make better decisions related to staffing, scheduling, and productivity management.
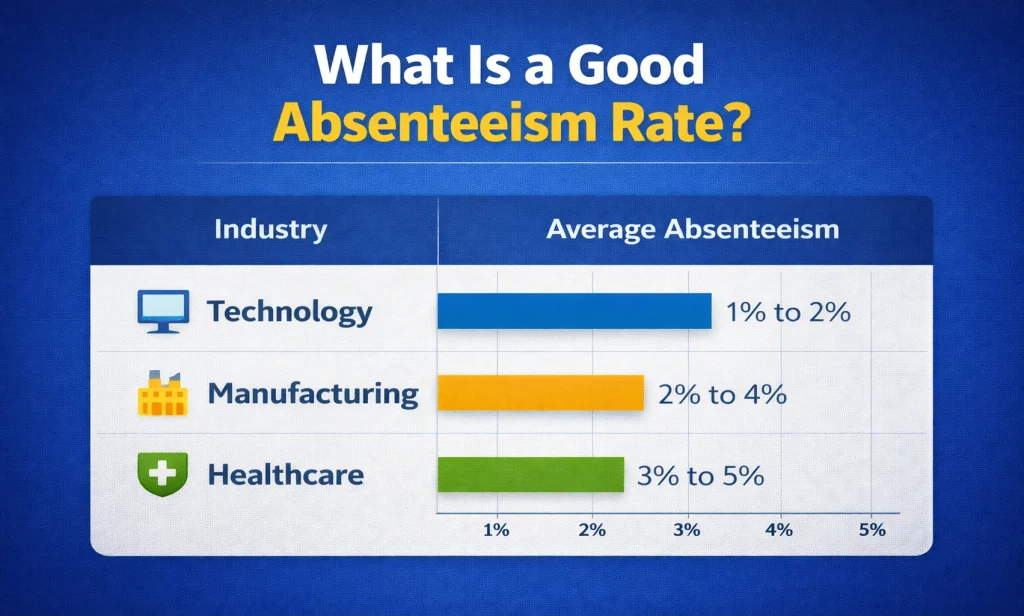
What Is a Good Absenteeism Rate
A good absenteeism rate varies depending on the industry, workforce structure, and working conditions. However, most HR studies show that organizations typically maintain an absenteeism rate between 1 percent and 3 percent. When the rate stays within this range, employee attendance is generally stable and unlikely to disrupt daily operations.