
What is A PERT Chart (How to Create One +Examples)
![]() Kapil Garg |
Updated: May 9, 2025
Kapil Garg |
Updated: May 9, 2025
![]() Kapil Garg |
Updated: May 9, 2025
Kapil Garg |
Updated: May 9, 2025
Are your projects consistently missing deadlines or exceeding budgets? You’re not alone. Recent data reveals that only 34% of organizations consistently complete projects on time, and just 43% stay within budget. A significant contributor to these challenges is inadequate planning. In fact, 39% of project failures are attributed to poor planning. Enter the PERT chart—a proven tool designed to enhance project scheduling and execution.
| Quick Summary: A PERT chart is a project management tool that helps teams visualize tasks, timelines, and dependencies to complete complex projects efficiently. This guide explains what PERT stands for, how PERT charts work, and walks you through the step-by-step process of creating one. You’ll learn about its core components, how to calculate time, and when to use it. We also include real-world examples, a free template, comparisons with Gantt charts, and expert tips to avoid common mistakes and boost project success. |
In this guide, we’ll delve into what PERT means, what a PERT chart is, how to create one, and provide real-world examples along with a ready-to-use template to streamline your project management process. So, let’s begin.
PERT stands for Program Evaluation and Review Technique, a project management tool used to plan, schedule, and coordinate tasks within a project. It helps project managers visualize the sequence of tasks, identify potential roadblocks, and estimate the time required to complete each task.
By focusing on task dependencies, PERT helps predict project timelines more accurately. The technique is particularly useful for projects with uncertain task durations, as it accounts for best-case, worst-case, and most likely scenarios.
Overall, PERT enhances project planning, risk management, and resource allocation, ensuring smoother execution and successful project completion. Now, that you have a clear idea of PERT def, let’s take a look at what PERT charts means in the next section.

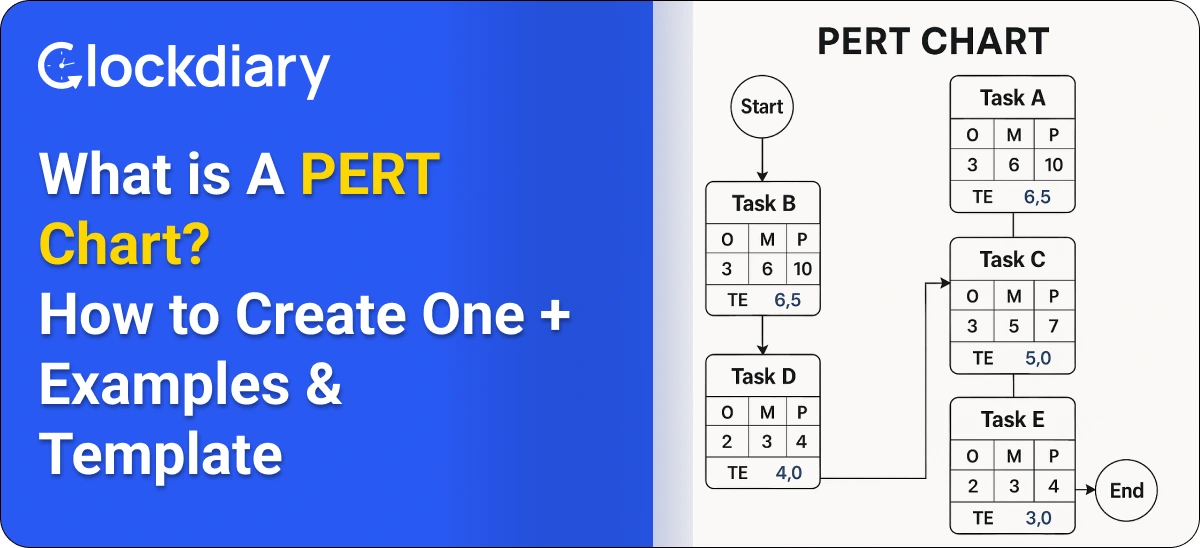
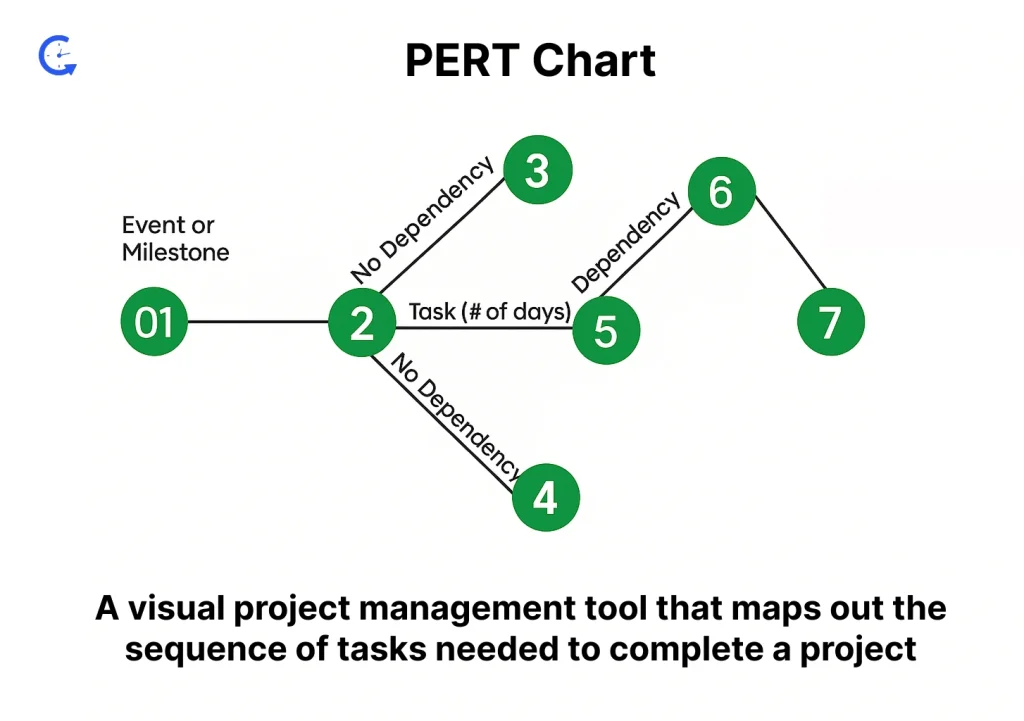
A PERT chart is a visual project management tool that maps out the sequence of tasks needed to complete a project. It uses nodes (representing tasks or milestones) and arrows (showing task dependencies) to create a flowchart of the entire project timeline. By incorporating three time estimates—optimistic, pessimistic, and most likely—PERT charts help predict project timelines with greater accuracy.
By laying out activities and their relationships, a PERT chart helps managers identify critical paths, estimate project duration, and manage potential roadblocks.
Unlike simple task lists, PERT charts emphasize the importance of task interdependencies and realistic scheduling, making them essential for complex, time-sensitive projects where forecasting and early risk identification are crucial.
With a clear idea of things like definition for PERT chart and PERT chart full form, now let’s take a look at the main components that make up this chart, along with its working mechanism in the upcoming sections.
A PERT chart may look complex at first glance, but it’s built from a few simple, powerful components. Each part plays a crucial role in mapping out a project’s flow and timelines effectively.
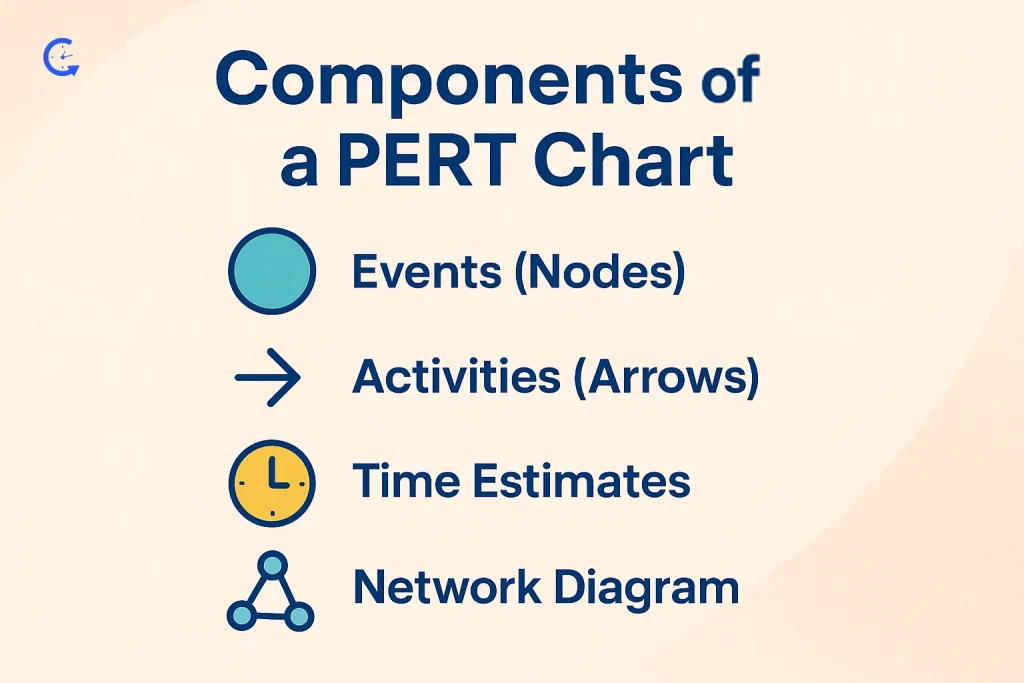
Events, often shown as circles or rectangles, represent key milestones or the start and end points of tasks. Each node marks either the initiation or completion of an activity. Nodes are not actions themselves but states of progress within the project, making it easy to visualize how far along the work is at any given moment.
For example, if your project is to launch a software product, events might include stages like “Product Design Completed,” “Beta Testing Completed,” and “Product Launch.” These events are connected to activities, showing the flow and sequence of the project.
Arrows connect the nodes and represent the tasks or activities that move the project forward. The direction of an arrow shows the flow of work and dependency relationships between events. Every arrow typically includes a label or identifier for easy tracking and time estimation.
For example, the task “Develop Product Features” may need to be completed before the “Product Testing” task can begin.
Time estimation is one of the key strengths of a PERT chart. For each activity, project managers gather three types of time estimates:
The Expected Time (TE) for each task is calculated using the formula:
| TE = (O + 4M + P) / 6 |
This formula PERT helps provide a more accurate estimate by weighing the most likely time more heavily. Mention not, top-down estimating method also comes in handy for estimating task durations.
When all nodes and arrows are connected, they form the network diagram—the full PERT chart. This diagram visually represents task sequences, dependencies, and project flow from start to finish. By analyzing the network, managers can identify the critical path, calculate slack time, and spot risks early, ensuring smarter project execution.
Understanding these core components makes it much easier to build, read, and manage projects using a PERT chart.
Understanding how a PERT chart functions can dramatically improve project planning and execution. Here’s a step-by-step breakdown of its core components:
The first step in creating a PERT chart is breaking down the entire project into individual tasks or activities. Each task represents a specific unit of work required to move the project forward. This granular approach ensures that no important activity is overlooked and sets the stage for accurate scheduling.
For example, if you’re managing a product launch, tasks might include designing the product, sourcing materials, and marketing. These tasks are then organized based on their dependencies, which we’ll address next.
Once the tasks are listed, the next step is to identify task dependencies—which tasks must be completed before others can start. For instance, you cannot begin marketing the product until it’s designed.
In a PERT chart, these relationships are represented by arrows connecting task nodes. This visual mapping clarifies the sequence of work, helping teams anticipate potential delays caused by bottlenecks.
As we have mentioned earlier, PERT charts uniquely incorporate three time estimates for each task:
For example, if designing a product is expected to take 3 weeks (optimistic), 5 weeks (most likely), and 7 weeks (pessimistic), the expected time can be calculated as follows:
| TE= [O + 4M + P] / 6 = [3 + 4(5) + 7] / 6 = [3 + 20+ 7] / 6 = 5 weeks |
This provides a balanced forecast for project scheduling.
If you are wondering how to determine critical path in PERT chart, we would like to point out that after time estimates are added, the longest path of dependent activities is identified, and this is what is known as the critical path.
Tasks on this path directly impact the overall project timeline. Any delay here will delay the project’s completion, making these activities high-priority. It is advised to practice effective time management strategies for better productivity, and thereby undertake high-priority tasks in the earliest possible moment.
Finally, the PERT chart reveals slack or float—the amount of time a task can be delayed without affecting the project end date. Tasks not on the pert chart critical path usually have slack time. For tasks on the pert chart critical path, there is no slack, meaning they must be completed on time.
Understanding slack helps project managers allocate resources efficiently, prioritize work, and manage risks proactively.
By mastering these elements, managers can use PERT charts to bring clarity, predictability, and control to even the most complex projects.
Creating a PERT chart doesn’t have to be overwhelming. By following a structured process, you can map even the most complex projects with confidence. Here’s how:
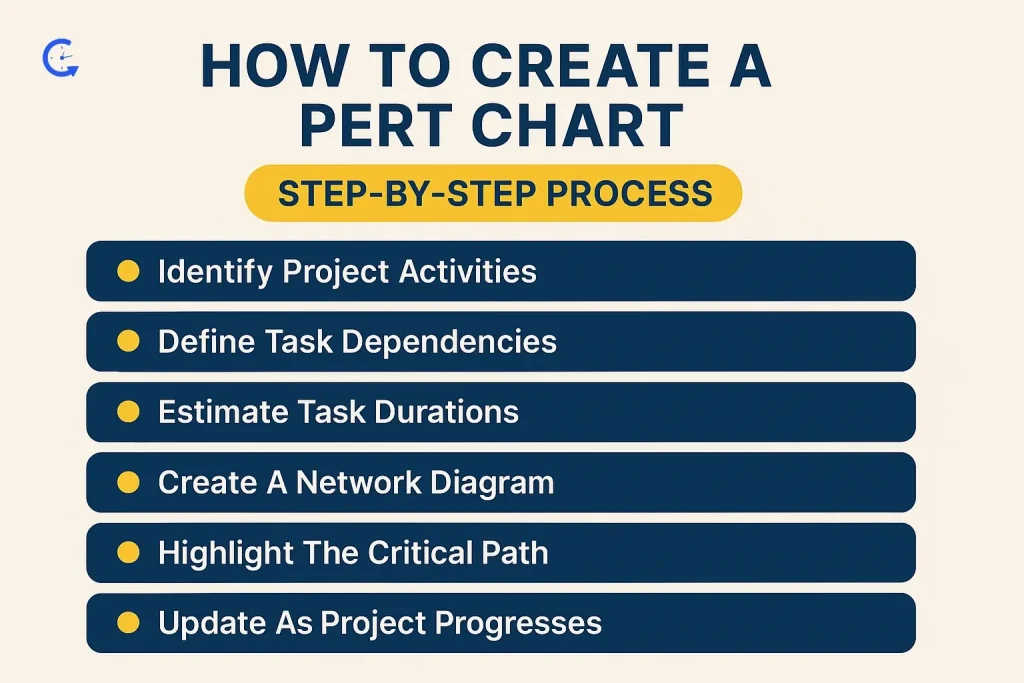
Start by listing all activities or tasks necessary to complete the project. Break down the work into manageable units. For instance, if you’re launching a new app, activities might include “Design User Interface,” “Develop Backend,” and “Conduct User Testing.”
A detailed activity list ensures no critical step is missed during the planning phase.
Next, determine how tasks are logically connected. Which activities must happen before others can begin? For example, “Develop Backend” must be completed before “Conduct User Testing” can begin.
Mapping these dependencies early reveals the sequence of work and potential roadblocks.
Gather time estimates for each task using the three-point estimation method: optimistic (O), pessimistic (P), and most likely (M) times. Then calculate the expected duration using the formula:
| TE = (O + 4M + P) / 6 |
For instance, if designing the interface could take 2 weeks (O), 4 weeks (M), and 6 weeks (P):
TE = [2 + 4(4) + 6] / 6 = [2 + 16 + 6] / 6 = 4 weeks
This ensures a more realistic and flexible schedule.
Now, transform the task list into a visual network diagram. Draw nodes for events (task start or completion) and connect them with arrows representing the activities. Make sure dependencies and sequences are accurately reflected.
Analyze the network to find the critical path—the longest sequence of dependent tasks. Tasks on this path directly impact the project timeline, making them the top priority for resource allocation and monitoring.
Calculate the slack for non-critical tasks. Slack indicates how much a task can be delayed without affecting the final project deadline, offering valuable flexibility in resource management.
Finally, remember that a PERT chart is a living document. Update it regularly as tasks are completed or conditions change to ensure your project remains on track and adaptable. We would like to point out here that you can avail of best time tracking apps for small business like Clockdiary for effective and efficient project tracking.
Using this step-by-step approach ensures your project planning is detailed, flexible, and realistic.
Seeing real-world PERT chart examples can make it much easier to understand how to apply this tool to your own projects. Whether you’re managing a small internal project or a multi-phase product launch, PERT charts bring structure and clarity to complex workflows.
Imagine planning a company event. Key tasks might include booking a venue, arranging catering, sending invitations, and setting up the event space. In a basic PERT chart:
In a tech project like a new app release, a PERT chart in software engineering could involve activities like requirement gathering, UI/UX design, coding, testing, and deployment.
With a PERT chart, project managers can spot which stages need the most attention and where delays could ripple through the timeline.
For larger projects, like building a new office, a PERT chart could visualize stages such as obtaining permits, laying the foundation, construction, inspections, and final handover. Dependencies are critical here—certain phases cannot begin until others are complete. A project evaluation and review technique chart helps teams align schedules, manage subcontractors, and mitigate risks proactively.
These examples show how versatile PERT charts are across industries, offering a clear view of timelines, dependencies, and critical activities to ensure smooth project execution.
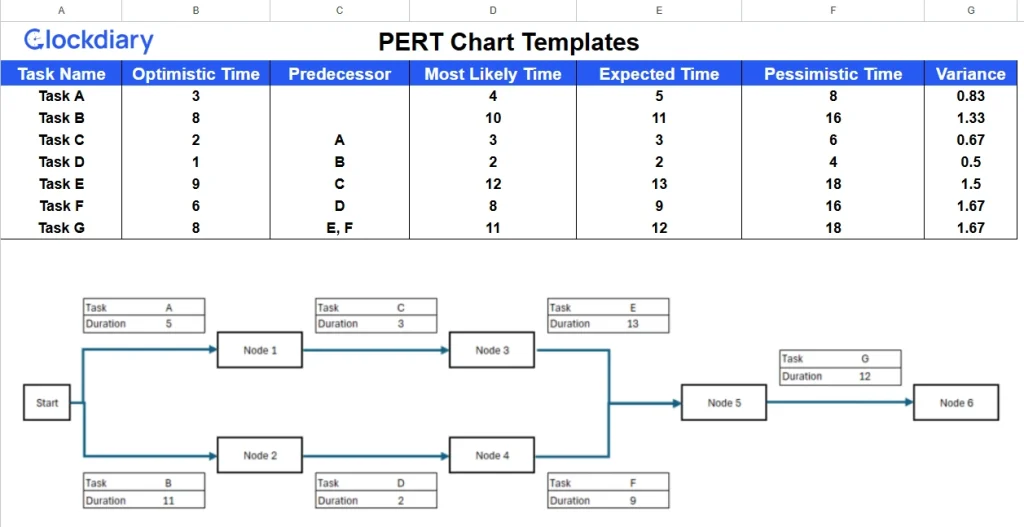
Creating a PERT chart from scratch can be time-consuming, especially when managing complex projects. That’s why having a ready-to-use PERT chart template can save you hours and help standardize your project planning process.
Whether you’re a project manager, product owner, or part of a PMO team, you don’t have to be a professional PERT chart maker. A downloadable template allows you to quickly map out tasks, define dependencies, estimate durations, and identify critical paths — all without starting from zero.
Our free PERT chart template is designed to be intuitive and customizable. It typically includes:
If you are on the lookout for PERT chart in Excel, this template is ideal for use in Excel or Google Sheets, and works for industries like IT, construction, marketing, manufacturing, and operations. Alternatively, if you want track time spent on projects, you can avail of best free Excel time tracking templates for project hours as well.
If you are looking for PERT chart generator online free, this is the one for you.
👉 [Download Your Free PERT Chart Template (Google Sheets)]
No sign-up required. Just click, copy, and start planning your next project with confidence.
Using a PERT chart template not only accelerates the planning process but also ensures your team stays aligned every step of the way.
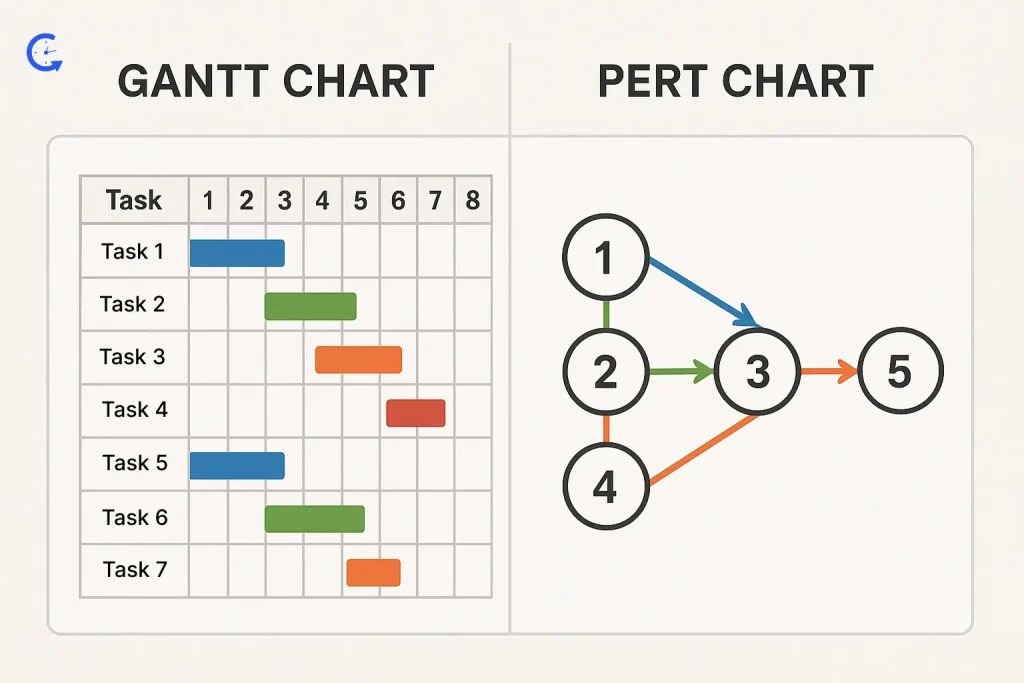
Are you in the dark about what is the difference between gantt chart and pert chart? While both gantt chart pert chart are popular project management tools, they serve slightly different purposes. Here’s a side-by-side comparison to help you choose the right tool for your project needs:
| Parameters | PERT Chart | Gantt Chart |
| Visualization | Network diagram showing tasks as nodes and dependencies as arrows. | Bar chart displaying tasks along a timeline. |
| Task Dependencies | Explicitly highlights task sequences and dependencies | Shows dependencies visually but focuses more on timing. |
| Time Estimation | Uses three-point estimation (optimistic, pessimistic, most likely) | Typically uses a single estimated duration per task. |
| Focus | Focuses on analyzing task flow, identifying critical path, and managing uncertainty. | Focuses on tracking progress against set timelines. A time tracker can prove to be a boon here. |
| Complexity | More complex; ideal for detailed planning of large, uncertain projects. | Simpler; ideal for straightforward scheduling and monitoring. |
| Use Cases | Best for R&D projects, large construction efforts, or any project with high uncertainty. | Best for marketing campaigns, software development, or event planning. |
In many cases, experienced project managers use gantt and pert charts together—leveraging PERT for planning and Gantt for execution tracking—to get the best of both worlds.
PERT charts are powerful tools for managing complex projects, but like any project evaluation method, they come with both strengths and limitations. Here’s a balanced look at the key advantages and disadvantages.
In short, PERT charts shine in complex, uncertain and deadline-sensitive projects—but they require commitment, accuracy, and the right context to be truly effective, making them unsuitable for every situation.
A PERT chart isn’t necessary for every project—but for the right scenarios, it can prove to be a boon. Here’s when using a program evaluation and review technique chart is especially valuable:
When you’re managing projects with multiple interdependent tasks, PERT charts help break down activities into manageable steps. For example, in a product development cycle involving research, design, testing, and launch, a PERT review chart helps break the project into manageable activities and define the order in which they must occur.
The network diagram clarifies the sequence of work and reveals task relationships that are often hard to see in traditional planning tools.
If meeting deadlines is critical, PERT charts help identify the minimum time required to complete a project. By focusing on the critical path and using the formula PERT, project managers can prioritize tasks that directly affect delivery dates and reduce the risk of delays.
In environments where time estimates are uncertain, such as R&D, innovation, or product or software development, PERT’s three-point estimation chart method offers more flexible planning. This allows teams to plan for best-case, worst-case, and most likely scenarios—essential for projects with unknowns.
For complex or large-scale projects with many moving parts, like infrastructure builds or ERP implementations, PERT charts offer a clear way to manage complexity. They help maintain control over project flow and reduce the chance of missing crucial steps or milestones.
PERT charts are ideal for spotting the critical path—the longest chain of dependent tasks that determines the project’s duration. This visibility helps managers focus on what matters most to keep the project on schedule.
When resources are limited, PERT helps determine where to allocate people, time, and budget for maximum impact. Knowing which tasks are flexible and which are time-sensitive ensures smarter decision-making.
To put it in a one-liner, use a PERT chart when clarity, accuracy, and strategic planning are essential to your project’s success.
Calculating time accurately is at the heart of using a PERT chart effectively. Besides, calculating the overall project duration, you must also consider calculating total employee work hours for efficient project management.
Here’s a step-by-step guide to understanding how time is estimated and used to predict overall project duration.
For every task in your project, begin by estimating three durations:
Use the formula PERT to calculate the expected time (E) for each activity:
| E = (O + 4M + P) / 6 |
This weighted average gives more importance to the most likely scenario, creating a balanced, realistic timeline for planning.
Once you’ve calculated the expected time for each task, map out all possible paths through the network diagram. The critical path is the longest sequence of dependent tasks, and it determines the shortest possible project duration.
Add up the expected durations of all activities on the critical path. This total gives you the estimated duration for the entire project—assuming no delays in critical tasks.
Let’s say a task has:
Then, E = (4 + 4×6 + 10) ÷ 6 = (4 + 24 + 10) ÷ 6 = 38 ÷ 6 ≈ 6.3 days
This project evaluation method helps plan with confidence, even when dealing with uncertainty.
While PERT charts are powerful tools, they can lose effectiveness if not used correctly. Here are the most common mistakes project managers make—and how to avoid them.
Problem: Skipping over task relationships leads to unrealistic timelines and sequencing errors.
Solution: Clearly define all preceding and succeeding tasks during the planning phase. Use logical dependencies to create an accurate workflow.
Problem: PERT focuses primarily on time and dependencies, but ignores costs, resource constraints, or scope.
Solution: Use PERT alongside tools like Gantt charts, resource plans, and risk matrices to get a comprehensive project view.
Problem: As the project progresses, outdated charts lose relevance and become misleading.
Solution: Treat the PERT chart as a living document—update it regularly to reflect task completions, delays, or changes in estimates. Use project management software like Clockdiary to streamline updates. Practicing timekeeping is also a good idea.
Problem: Overly detailed charts with too many tasks or dependencies become hard to read and manage.
Solution: Strike a balance. Focus on critical activities and major milestones, and keep the chart clean and scannable.
Problem: Using PERT for projects that are simple or repetitive wastes time and adds unnecessary complexity.
Solution: Reserve PERT for complex, time-sensitive, or uncertain projects where its strengths are most impactful.
Problem: Poorly estimated task durations undermine the entire chart’s reliability.
Solution: Use the three-point estimation method and involve experienced team members in the planning process.
Problem: Without ongoing monitoring, delays go unnoticed until it’s too late.
Solution: Set regular checkpoints to review and revise the PERT chart as part of your project tracking routine.
To get the most out of your PERT chart, go beyond the basics. These advanced tips will help you build smarter schedules, improve accuracy, and manage large-scale projects with confidence.
Use the PERT formula: E = (O + 4M + P) / 6
Example: If O = 2, M = 4, P = 8 → E = (2+16+8) / 6 = 26 / 6 ≈ 4.3 days
This technique smooths out estimation uncertainty and improves timeline reliability.
Clearly identify all task dependencies. Use arrows to connect related tasks and visualize task flow and logic. Incorporate parallel activities to reflect true scheduling flexibility and better resource utilization.
Always identify the critical path, the longest sequence of tasks without slack. This path determines project duration. Monitor slack time and add time buffers to high-risk tasks to maintain control over project deadlines.
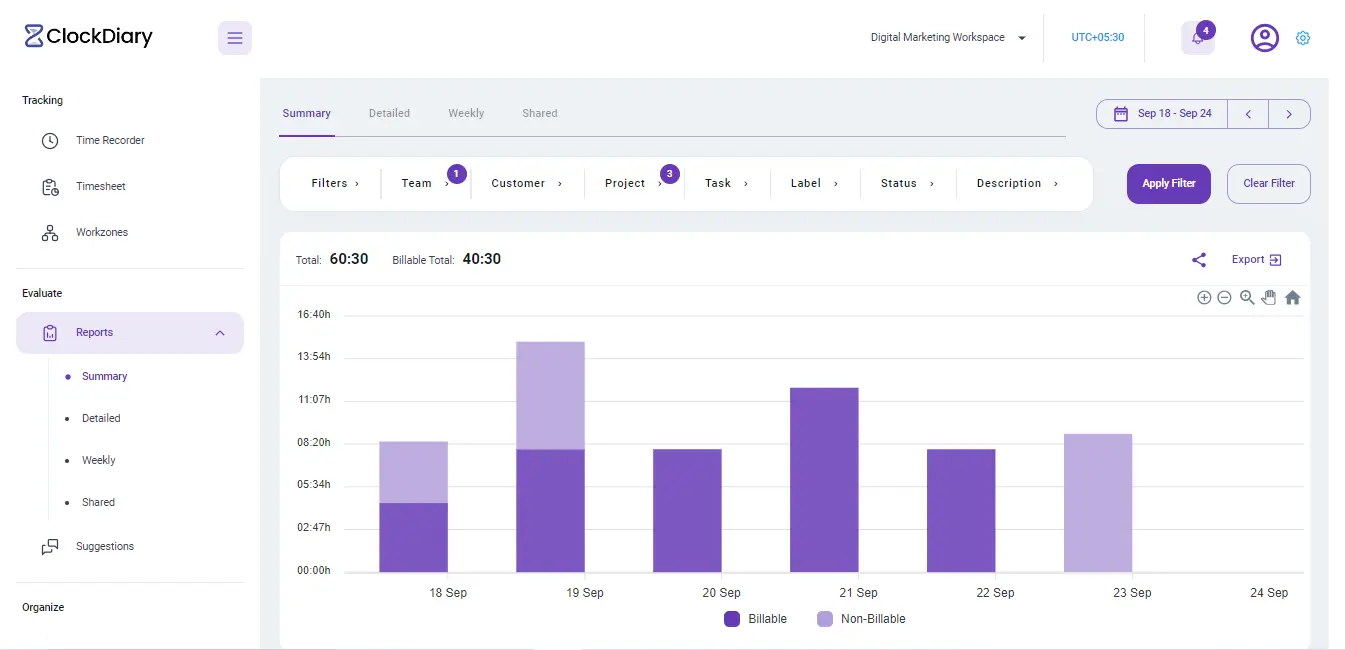
PERT charts aren’t static. As your project evolves, so should your chart. Use it for dynamic planning, regularly update durations, and re-calculate the critical path to stay accurate. Time tracking apps like Clockdiary provide real-time updates, thereby promoting transparency and accountability like none other.
Use your PERT chart as an effective communication tool. Highlight the critical path, use clear labeling, and keep the chart clean for transparent stakeholder discussions.
For smaller teams, Excel or Google Sheets with PERT chart templates can do the job well. Alternatively, you can opt for good project management tools like Clockdiary for efficient project management.
Mastering these project review techniques ensures your PERT charts become powerful tools for project control and success.
If you’re finding it challenging to fully leverage PERT charts for project planning, the best time tracking app Clockdiary offers a suite of features designed to enhance your project management experience.
While PERT charts are excellent for visualizing task sequences and dependencies, integrating them with Clockdiary’s robust tools can streamline your workflow and improve efficiency.
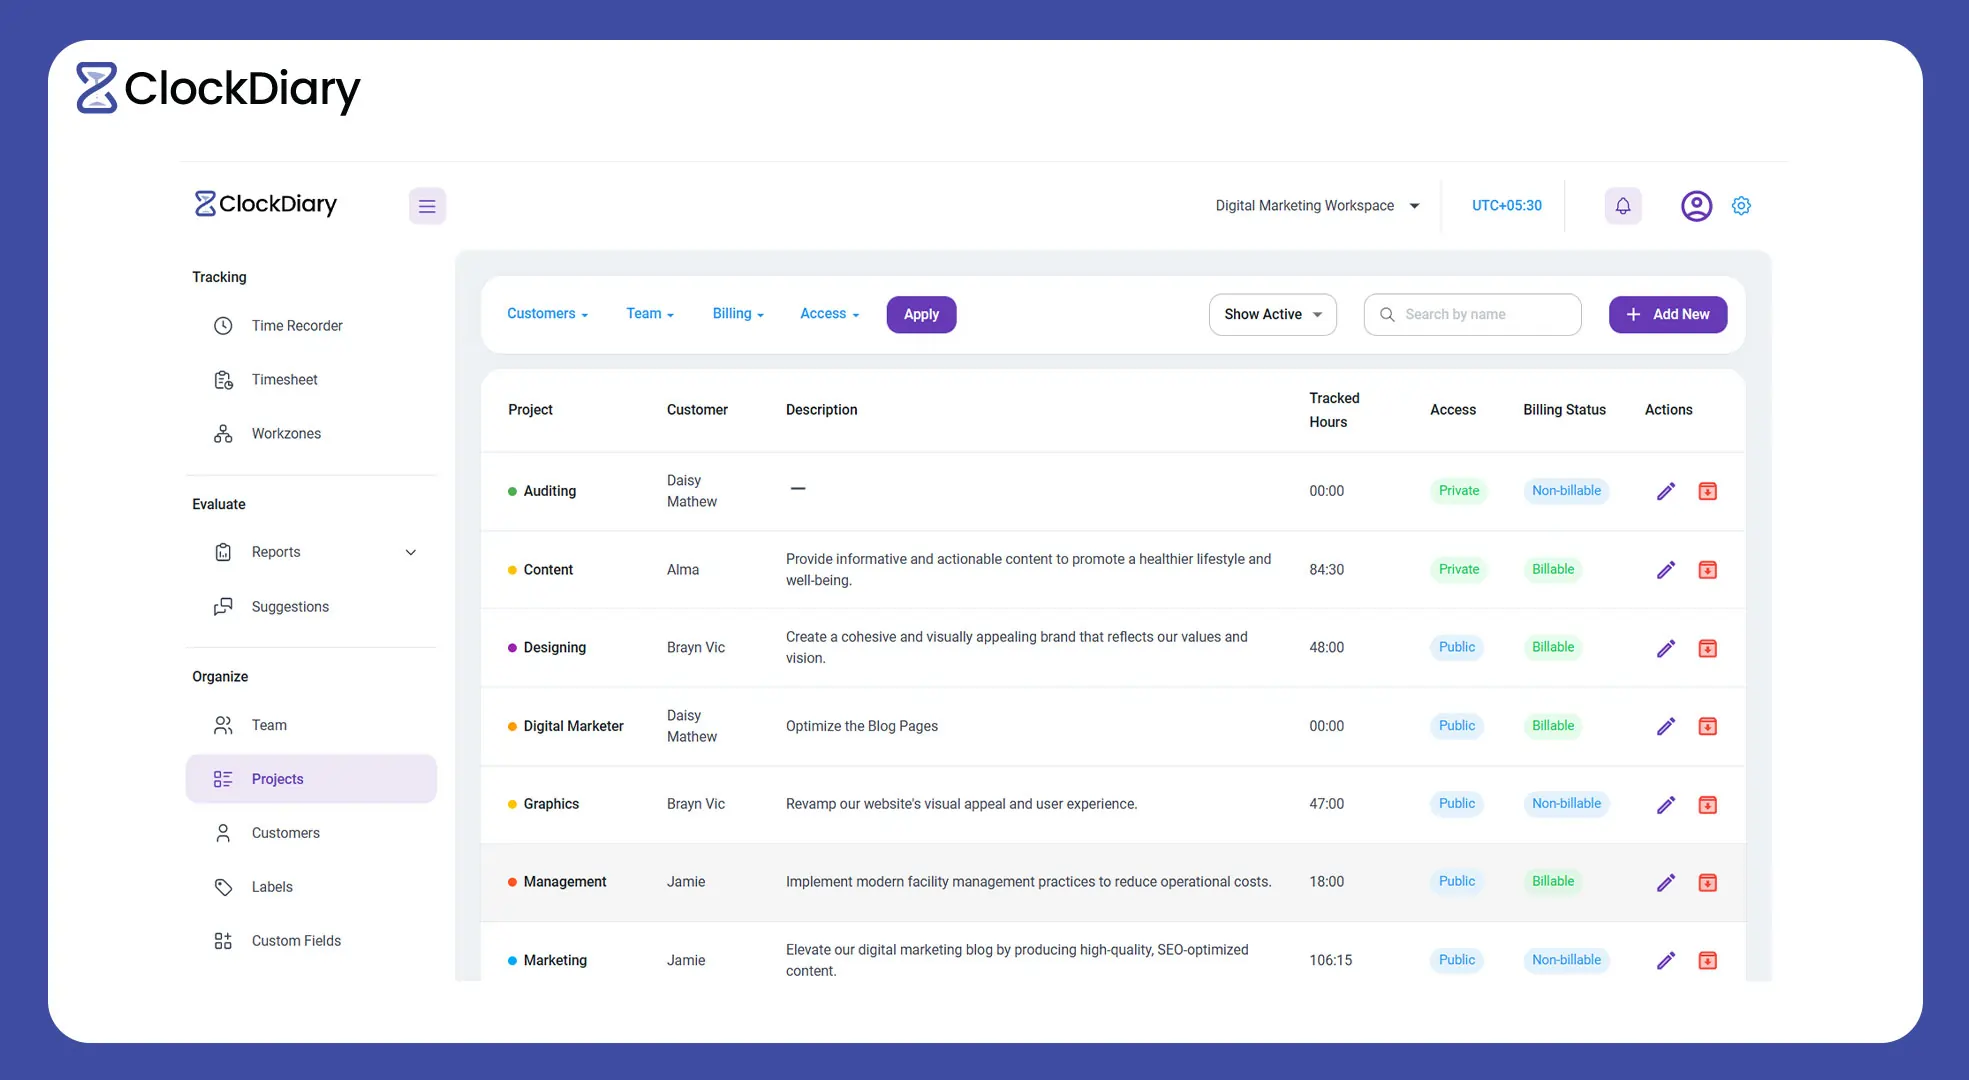
Thus, we can say that by leveraging Clockdiary’s powerful features, you can overcome the complexities associated with PERT charts, leading to more effective project planning and execution. So, what are you waiting for? Integrate this technological wizardry into your workflow and see the difference for yourself.

Frequently Asked Questions:
A PERT chart (Program Evaluation and Review Technique) is a visual project management tool used to schedule, organize, and coordinate tasks within a project by mapping out task sequences, durations, and dependencies.
For example, in a software development project, a PERT chart might show tasks like planning, coding, testing, and deployment—highlighting which tasks must be completed first and which can run in parallel.
In software engineering, a PERT chart is used to plan, schedule, and manage complex development tasks by visually mapping out the sequence and duration of each activity. It helps engineers identify dependencies, estimate timeframes, and determine the critical path to ensure timely and efficient project delivery.
To calculate slack time in a PERT chart, subtract the earliest start time (ES) from the latest start time (LS) or the earliest finish (EF) from the latest finish (LF) for each activity: Slack = LS – ES or LF – EF. Activities with zero slack lie on the critical path and cannot be delayed without affecting the project timeline.
To make a PERT chart in Excel, list all project tasks along with their dependencies and durations, then use shapes (circles for nodes and arrows for activities) to visually map the workflow. You can enhance clarity by adding estimated times, labeling critical paths, and using Excel’s drawing tools or SmartArt for better visualization.
The critical path in a PERT chart is the longest sequence of dependent tasks that determines the shortest possible duration to complete a project. If any task on this path is delayed, the entire project timeline is affected, making it essential for project managers to monitor closely.
Gantt and PERT charts are vital to organizations because they provide clear visualizations of project timelines, task dependencies, and progress, helping teams stay organized and aligned. By improving planning, resource allocation, and deadline tracking, these tools significantly enhance project efficiency and reduce the risk of delays or budget overruns.
To convert a Gantt chart into a PERT chart, start by identifying all project tasks, their durations, and dependencies shown in the Gantt timeline. Then, use that information to create a network diagram that visually maps task sequences and dependencies, which forms the foundation of the PERT chart.